
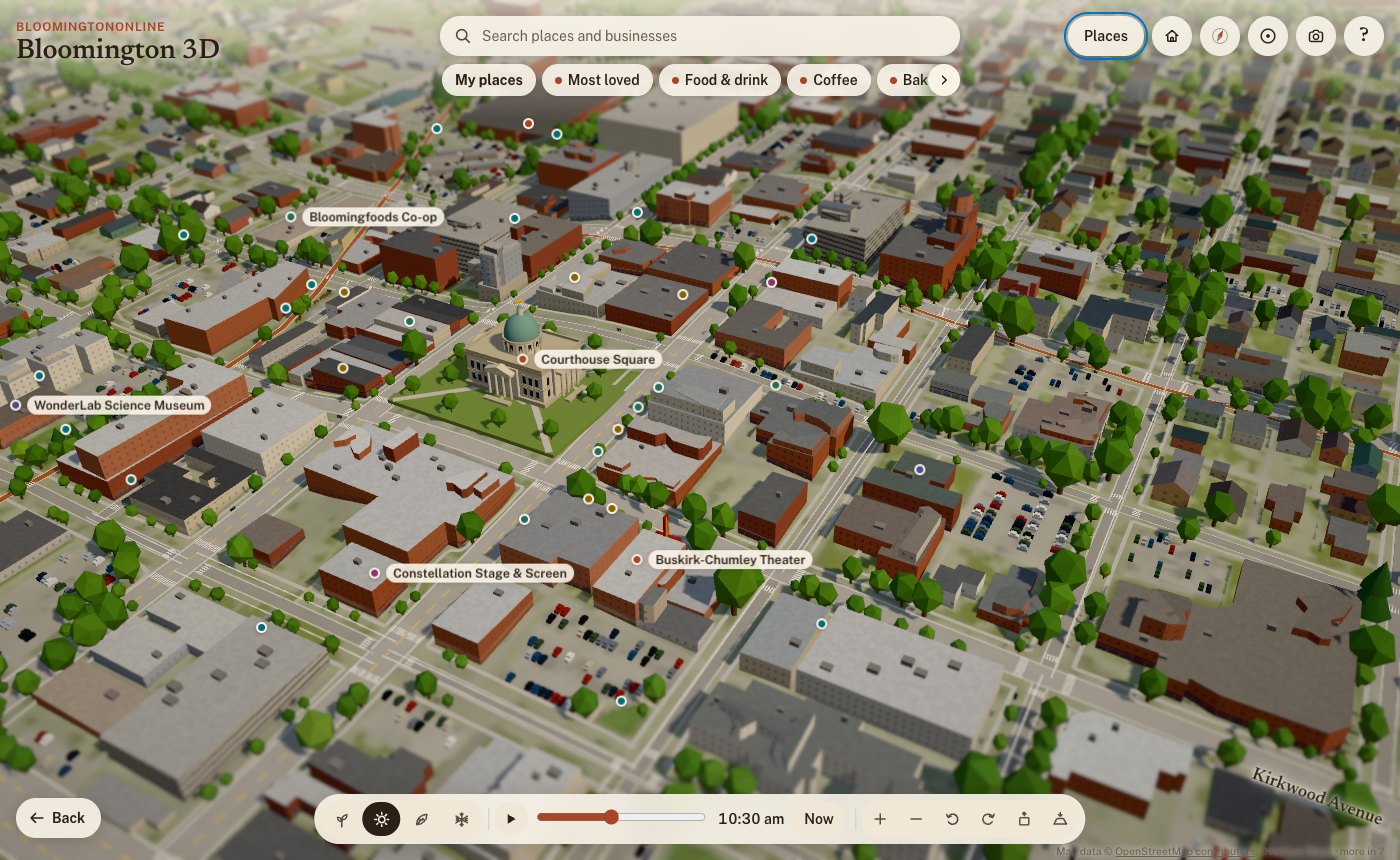
Two days ago there was no 3D Bloomington. Now there’s one you can fly around, from the copper fish on the courthouse to the sailboats on Lake Monroe. It’s built from real survey data, it lights up at dusk, it changes with the seasons, and every business in our directory can show up on it. Here’s what we built, where the data came from, and how it came together.
What it is
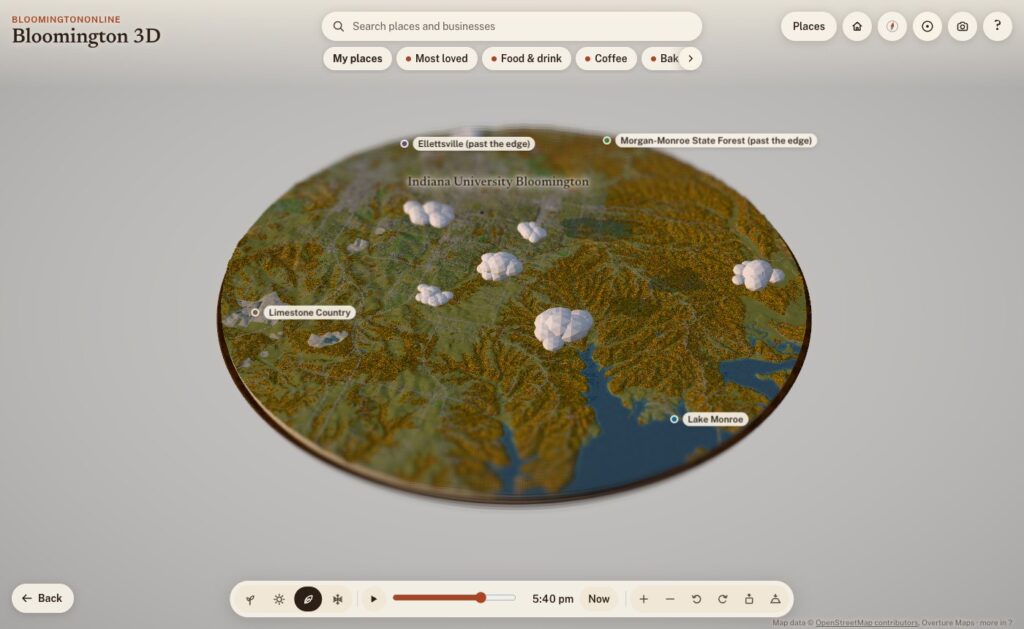
Bloomington 3D is a model of Bloomington and the country around it: a round board about 19 kilometers (12 miles) across, centered just south of downtown, sitting on a walnut plinth like a museum diorama. The cut edge shows layers of limestone, and where the board slices through Lake Monroe you can see the water in cross-section.
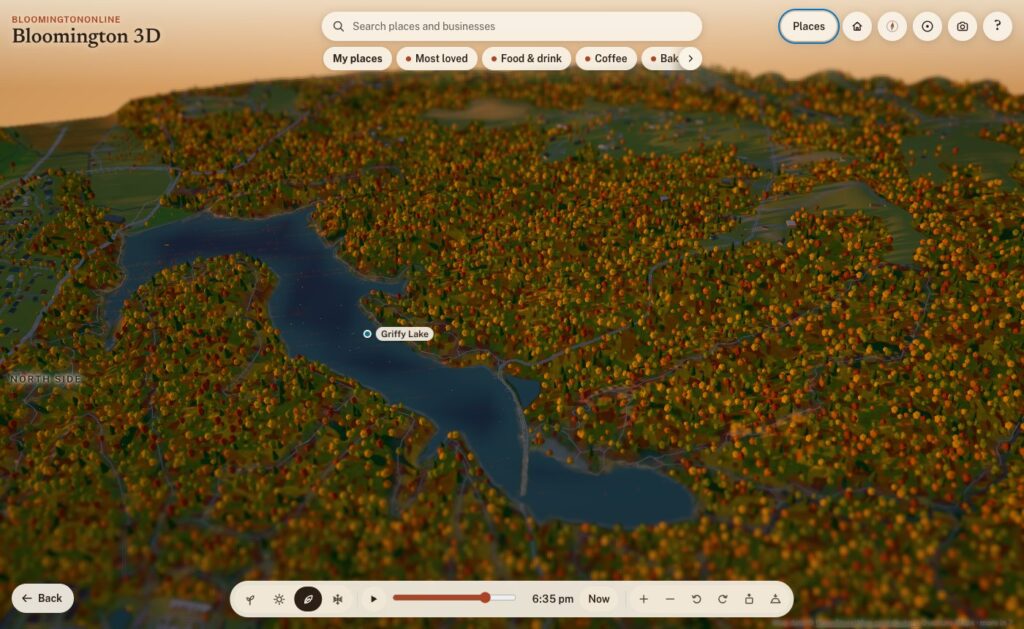
It runs in any modern browser, on a phone or a computer, with nothing to install. It opens on the Courthouse Square. Drag to move, pinch or scroll to zoom, and tap anything outlined, pinned or named to read about it. Each place has a card with a short, fact-checked write-up, nearby places to wander to next, and a link you can share. For example, bloomingtononline.com/town/#griffy opens straight onto Griffy Lake.
Where the town comes from
None of the geography is drawn by hand. Every street, building, tree and creek comes from public data, and the map credits each source on screen. Here’s what’s in it.
Streets, buildings and paths: OpenStreetMap
The base layer is OpenStreetMap, the volunteer-built map of the world. It supplies the roads, the B-Line and the other trails, the creeks, parks, rail lines and building footprints. It also has the small things you notice once you zoom in: about 2,900 sidewalk segments and 4,300 other footpaths, crosswalks, bike lanes, benches, bike racks, picnic tables and parking lots, which fill up with little parked cars.
The hills: USGS elevation data
Southern Indiana isn’t flat, and the model shouldn’t be either. The terrain comes from USGS elevation data via open terrain tiles, with the hills exaggerated about two times so the ridges and hollows read at a glance, the way a museum diorama does. Buildings and trees stand at their real heights. Where OpenStreetMap doesn’t map the woods, the model fills undeveloped slopes with forest, because that’s what our hollows are.
Real building heights: 154 million laser points
This is the part I’m proudest of. Indiana was flown with lidar between 2017 and 2019 for the USGS 3D Elevation Program: an airplane sweeps a laser across the ground and records where every pulse bounces back. We streamed the 21 tiles that cover downtown, campus, Prospect Hill, Elm Heights, Bryan Park and the near west side, which is 154.6 million points, and turned them into a one-meter grid of the town.
From that grid, the model measures:
- the eave and ridge height of 11,565 buildings, so roofs are the right height and the right shape
- stepped roofs on bigger buildings, traced in tiers every 3.5 meters, so a building with a tall section and a low wing looks like that
- towers that rise above the rest of a building
- the tree canopy, so the woods and big yard trees stand where they really are
- the bare ground under it all, more detailed than the terrain everywhere else
Outside that core, building heights come from Microsoft’s machine-learning estimates, published through Overture Maps, which also fills in buildings OpenStreetMap doesn’t have yet. All told, there are about 35,000 buildings on the board.
Roof colors: the 2025 aerial photos
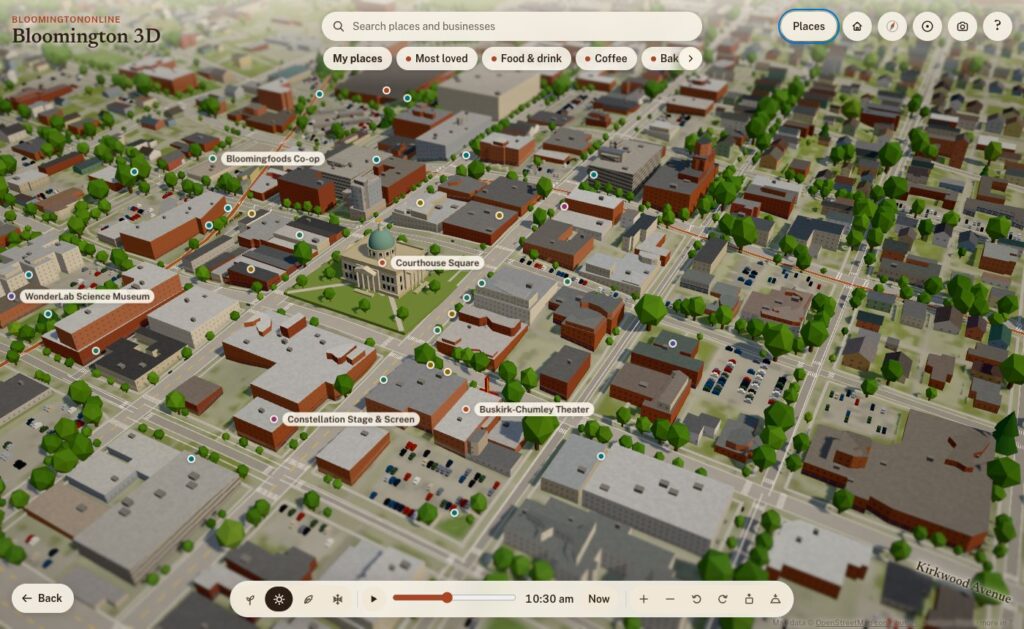
Flying over a model where every roof is the same gray is boring, and it isn’t Bloomington. So for 11,518 roofs in the core, the model samples the real color from IndianaMap’s 2025 statewide aerial imagery: the red metal roofs, the white flat roofs on campus, the weathered shingles. The same photos also lighten the ground where there’s paving and green it where there’s grass. We use the photos as data, not as a texture, so everything stays in the model’s diorama style.
36,000 real trees, and fall colors by species
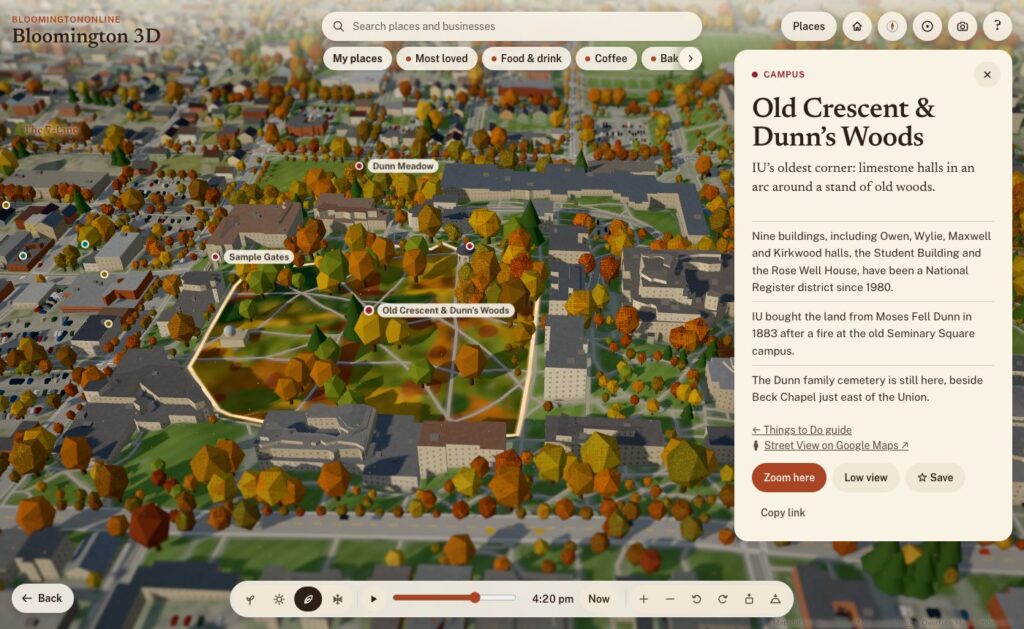
The City of Bloomington keeps an inventory of its street and park trees, and IU surveyed its campus trees in 2019. Together that’s about 36,000 trees on the board, each standing where it really stands, and each with its species. So in fall:
- red maples, sweetgums and red oaks turn red
- sugar maples turn orange
- tulip trees, ginkgos, honeylocusts and redbuds turn yellow
- white oaks, beeches and sycamores go bronze
- pines, spruces and cedars stay green
In spring, the redbuds and crabapples bloom pink and the dogwoods and pears bloom white. Dunn’s Woods and the campus look different from the near west side because they’re planted differently, and the model knows it. Beyond the inventories, trees follow the lidar canopy in the core and the landcover everywhere else.
The city’s own maps
From the City of Bloomington’s open data we use:
- Historic districts and neighborhood boundaries: outlines like Prospect Hill and Elm Heights are the city’s own.
- The bikeways layer.
- The historic buildings survey: houses it rates as historic get an older-house look in Elm Heights and Prospect Hill.
- The public art inventory: 42 outdoor works, each with the city’s photo, artist, year and medium. A “Public art” walk visits them in order, starting at the Square.
And BloomingtonOnline itself
Our own content is on the map too:
- Things to Do guide: 67 places, linked both ways.
- Neighborhoods guide: the north, east, south and west sides of town.
- The business directory: more on that below.
Light, time and the seasons
By default the model runs on live Bloomington time. The sun is where the real sun is, calculated for our latitude down to the minute, daylight saving time included. Watch it long enough and the shadows swing across the Square, the sky warms at golden hour, the street lamps come on, and the windows downtown light up after dark.
Live mode also follows the calendar, and the four season buttons let you jump ahead:
- Spring: the redbuds and dogwoods bloom.
- Summer: sailboats on Lake Monroe, paddlers on Griffy, and fireflies at dusk.
- Fall: the species colors, with leaves drifting down.
- Winter: snow on the roofs, wet streets and moonlit fields.
Some details only show up at the right moment. The farmers’ market tents are on Showers Common on Saturday mornings from April through October. From the Friday after Thanksgiving through December, the Canopy of Lights glows over the Square at night.
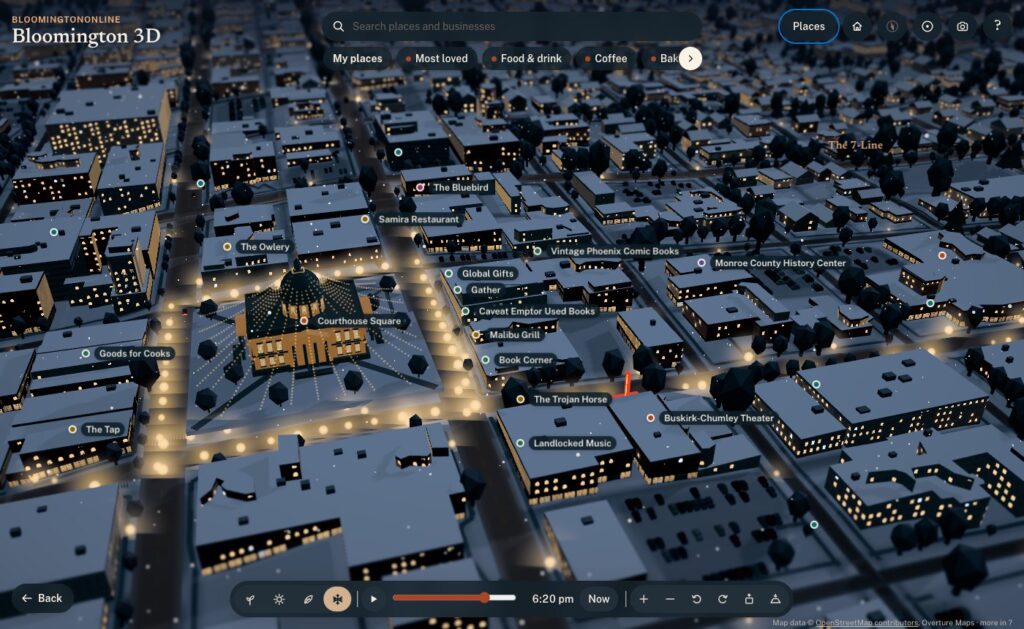
You can also link to a moment. Adding ?season=winter&time=18:30#square to the address opens on the Canopy of Lights at dusk, which is handy for stories.
Hand-built landmarks
Data gets you most of the way. A few places deserved to be modeled by hand:
- The courthouse: its dome and windowed drum, the copper fish weathervane, and window rows that light up at night.
- Campus: the Sample Gates, the Rose Well House, Kirkwood Observatory’s dome, Showalter Fountain, the IU Auditorium’s front and the field at Memorial Stadium.
- Downtown: the Buskirk-Chumley’s marquee and the sawtooth roof of the old Showers plant, now City Hall.
- The Little 500 track.
- Grout piles: heaps of waste limestone blocks along the rims of the quarries.
Older brick blocks within a few minutes’ walk of the Square get storefronts, awnings, arched upper windows and limestone cornices.
Ways to explore
- A first look: a guided tour of the highlights.
- Fly-alongs: rides along the B-Line, Kirkwood and out to Clear Creek. Nine more stay low: on foot down Fourth Street, College Avenue, Walnut, Third Street and 10th Street through campus, and by bike along the 7-Line, Cascades, Jackson Creek and the Karst Farm Greenway. The low routes were checked against the lidar so the camera clears every roof and treetop.
- Low view: drops you to about 10 meters, looking down the street toward the horizon. Smaller places link to Google Street View when you want the real photos.
- Circling: pick a place and the view slowly circles it, like Google Earth after a search.
- Home, Back and the compass: Home takes you back to the Square, Back to your last view, and the compass to north, then straight down.
- Save a picture: the camera button saves the current view as an image, credit included.
The business directory, on the map
This is where the model stops being a pretty picture and becomes part of BloomingtonOnline:
- Every business on its building. More than 1,900 directory listings now have a See it on the 3D map button. The model places each one on its actual building, matched by name and address against OpenStreetMap and Overture, instead of rough estimates from street address ranges. Businesses just past the edge of the board get a pin on the rim pointing their way.
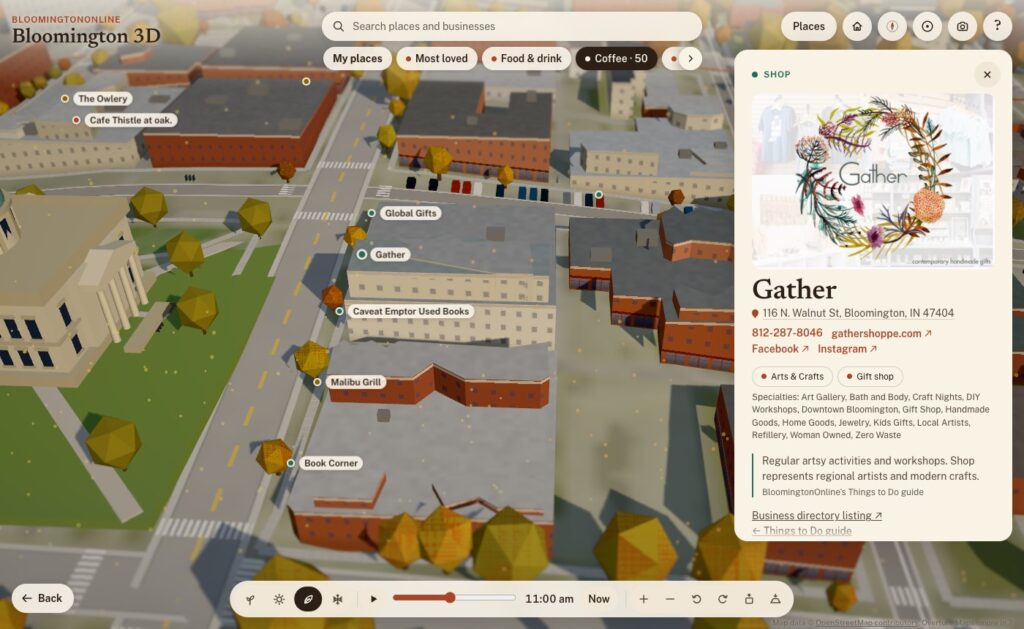
- Categories as layers. The chips under the search box show one kind of business at a time: Food & drink, Coffee, Bakeries, Bars & nightlife, Pizza, Shops, Arts & entertainment, and Fitness & recreation. More has every directory category. Category pages in the directory link to their view on the map, so coffee is one tap away.
- Search the whole directory. Type a name and any business on the board comes up.
- Rich business cards. Each card has the business’s photo, its categories and specialties, the address (linked to Google Maps), tap-to-call phone, website and social links. A Flag this listing link reaches our correction form.
- My places. Tap Save on any place or business, here or on its directory page, and it goes into your own list on the map. You can share the whole list with a link.
- Locals love this. A heart on every business. Votes add up, and Most loved shows the favorites on the map.
Putting the directory on a map also showed us where the directory needed work. Over the years, several bulk imports had added some businesses two or three times. So we built a review page, went through every suspected duplicate, and merged 194 duplicate listings into the right ones. Nothing was lost: phone numbers, photos, categories and tags were combined, and every old address now redirects to the listing that stayed. The directory now warns us when a new listing looks like one we already have.
How it was built
I built Bloomington 3D with Claude Code, Anthropic’s AI coding agent, working as a two-person team: I set the direction, judged the results and knew the town, and Claude wrote the code, chased down the data and tested everything before it went live. Every feature went through the same loop:
- Ask. I’d describe what I wanted in plain words: “add Third Street too”, “the category selectors are being cut off”, “let’s make a camera icon for saving the view”.
- Build. Claude found the right data or wrote the code, often several pieces at once.
- Test. Every change was checked in a real browser, on desktop and phone sizes, before it shipped. That included flying the camera down the new fly-alongs and clicking through the new buttons.
- Ship. A one-command deploy publishes the new version to the site, keeping the old one for an instant rollback, and every change is saved in version control. As of this writing there are 146 of them.
A few principles held the whole way through:
- Facts first. Every claim on a place card traces back to a source on a fact sheet, and the copy was fact-checked twice. If something couldn’t be verified, it stayed out. That’s why the cards don’t say why the courthouse has a fish: nobody knows for sure.
- Open data, credited. Every source is credited on the map. There’s no paid mapping service, no API key, and no recurring cost.
- Private by default. The map loads nothing from third parties and has no tracking. Your saved places stay on your own device.
- Works on a phone. The model picks a lighter quality level on phones, runs slower when nothing’s moving to save battery, and offers lighter graphics if things get choppy. It scores 100 for accessibility on Google’s Lighthouse test.
Two days, start to now
Day one (Sunday).
- Early afternoon: the first version, OpenStreetMap streets and buildings on terrain, with a tilt-shift look that makes it feel like a miniature.
- Next two hours: three art-direction passes, then night lighting, seasons, the guided tour, landmarks, boats, storefronts and performance tuning for phones.
- About 3 p.m.: it went live on the site.
- Next hour: the lidar heights, roof colors, real trees, city outlines, public art and the first directory integration.
- Evening: the Things to Do guide, the low fly-alongs, circling, directory pins on their buildings and category layers. It also got its name. It had started life as “Bloomington in miniature”, which I didn’t love.
Day two (Tuesday).
- Neighborhoods: from our own guide.
- Close-up detail: sidewalks, soft contact shadows, stepped roofs, ground detail and courthouse windows.
- Getting closer: low view and Street View links.
- Finding things: the search bar with category chips, and friendlier controls (Home, Back, double-tap to zoom, first-visit tips).
- Links and history: working browser Back and Forward, and shareable links that stay tidy.
- Directory features: richer business cards, My places, Locals love this, and pins for businesses just past the edge.
- Directory cleanup: the duplicate merge.
A lot of the best changes came from simply using it. On day one I noticed the business pins weren’t quite on their buildings. The directory’s locations were estimates from street address ranges, often 20 to 100 meters off, so we matched every listing to its actual building instead. Coming in from a directory listing, I noticed the address bar kept the old business’s name. The browser’s Back button didn’t walk back through places. The category chips were cut off on a phone. Each of those took minutes to fix once I’d noticed it.
Where it goes from here
After two days, Bloomington 3D includes:
- about 35,000 buildings and 36,000 real trees
- 50 written-up places, 67 Things to Do and 42 works of public art
- a dozen fly-alongs
- more than 1,900 businesses
- four seasons and a sun that keeps real time
It’s also a living thing, and that’s the exciting part. A few ideas on the list:
- a “show where I am” button
- events on the map
- live weather
- more guided tours drawn from our guides
- your saved places following you from device to device
But the best next steps will come from you. Take it for a spin, find your street, and save your favorite spots. Then tell us what you’d like to see, what’s missing, or what we got wrong. If a business is on the wrong building or out of date, use Flag this listing on its card. We read every one.
Map data: © OpenStreetMap contributors (ODbL); Overture Maps, including Microsoft building height estimates; USGS 3D Elevation Program lidar (Indiana Statewide 2017); IndianaMap 2025 imagery; City of Bloomington GIS; Indiana University campus tree inventory; AWS Terrain Tiles.